


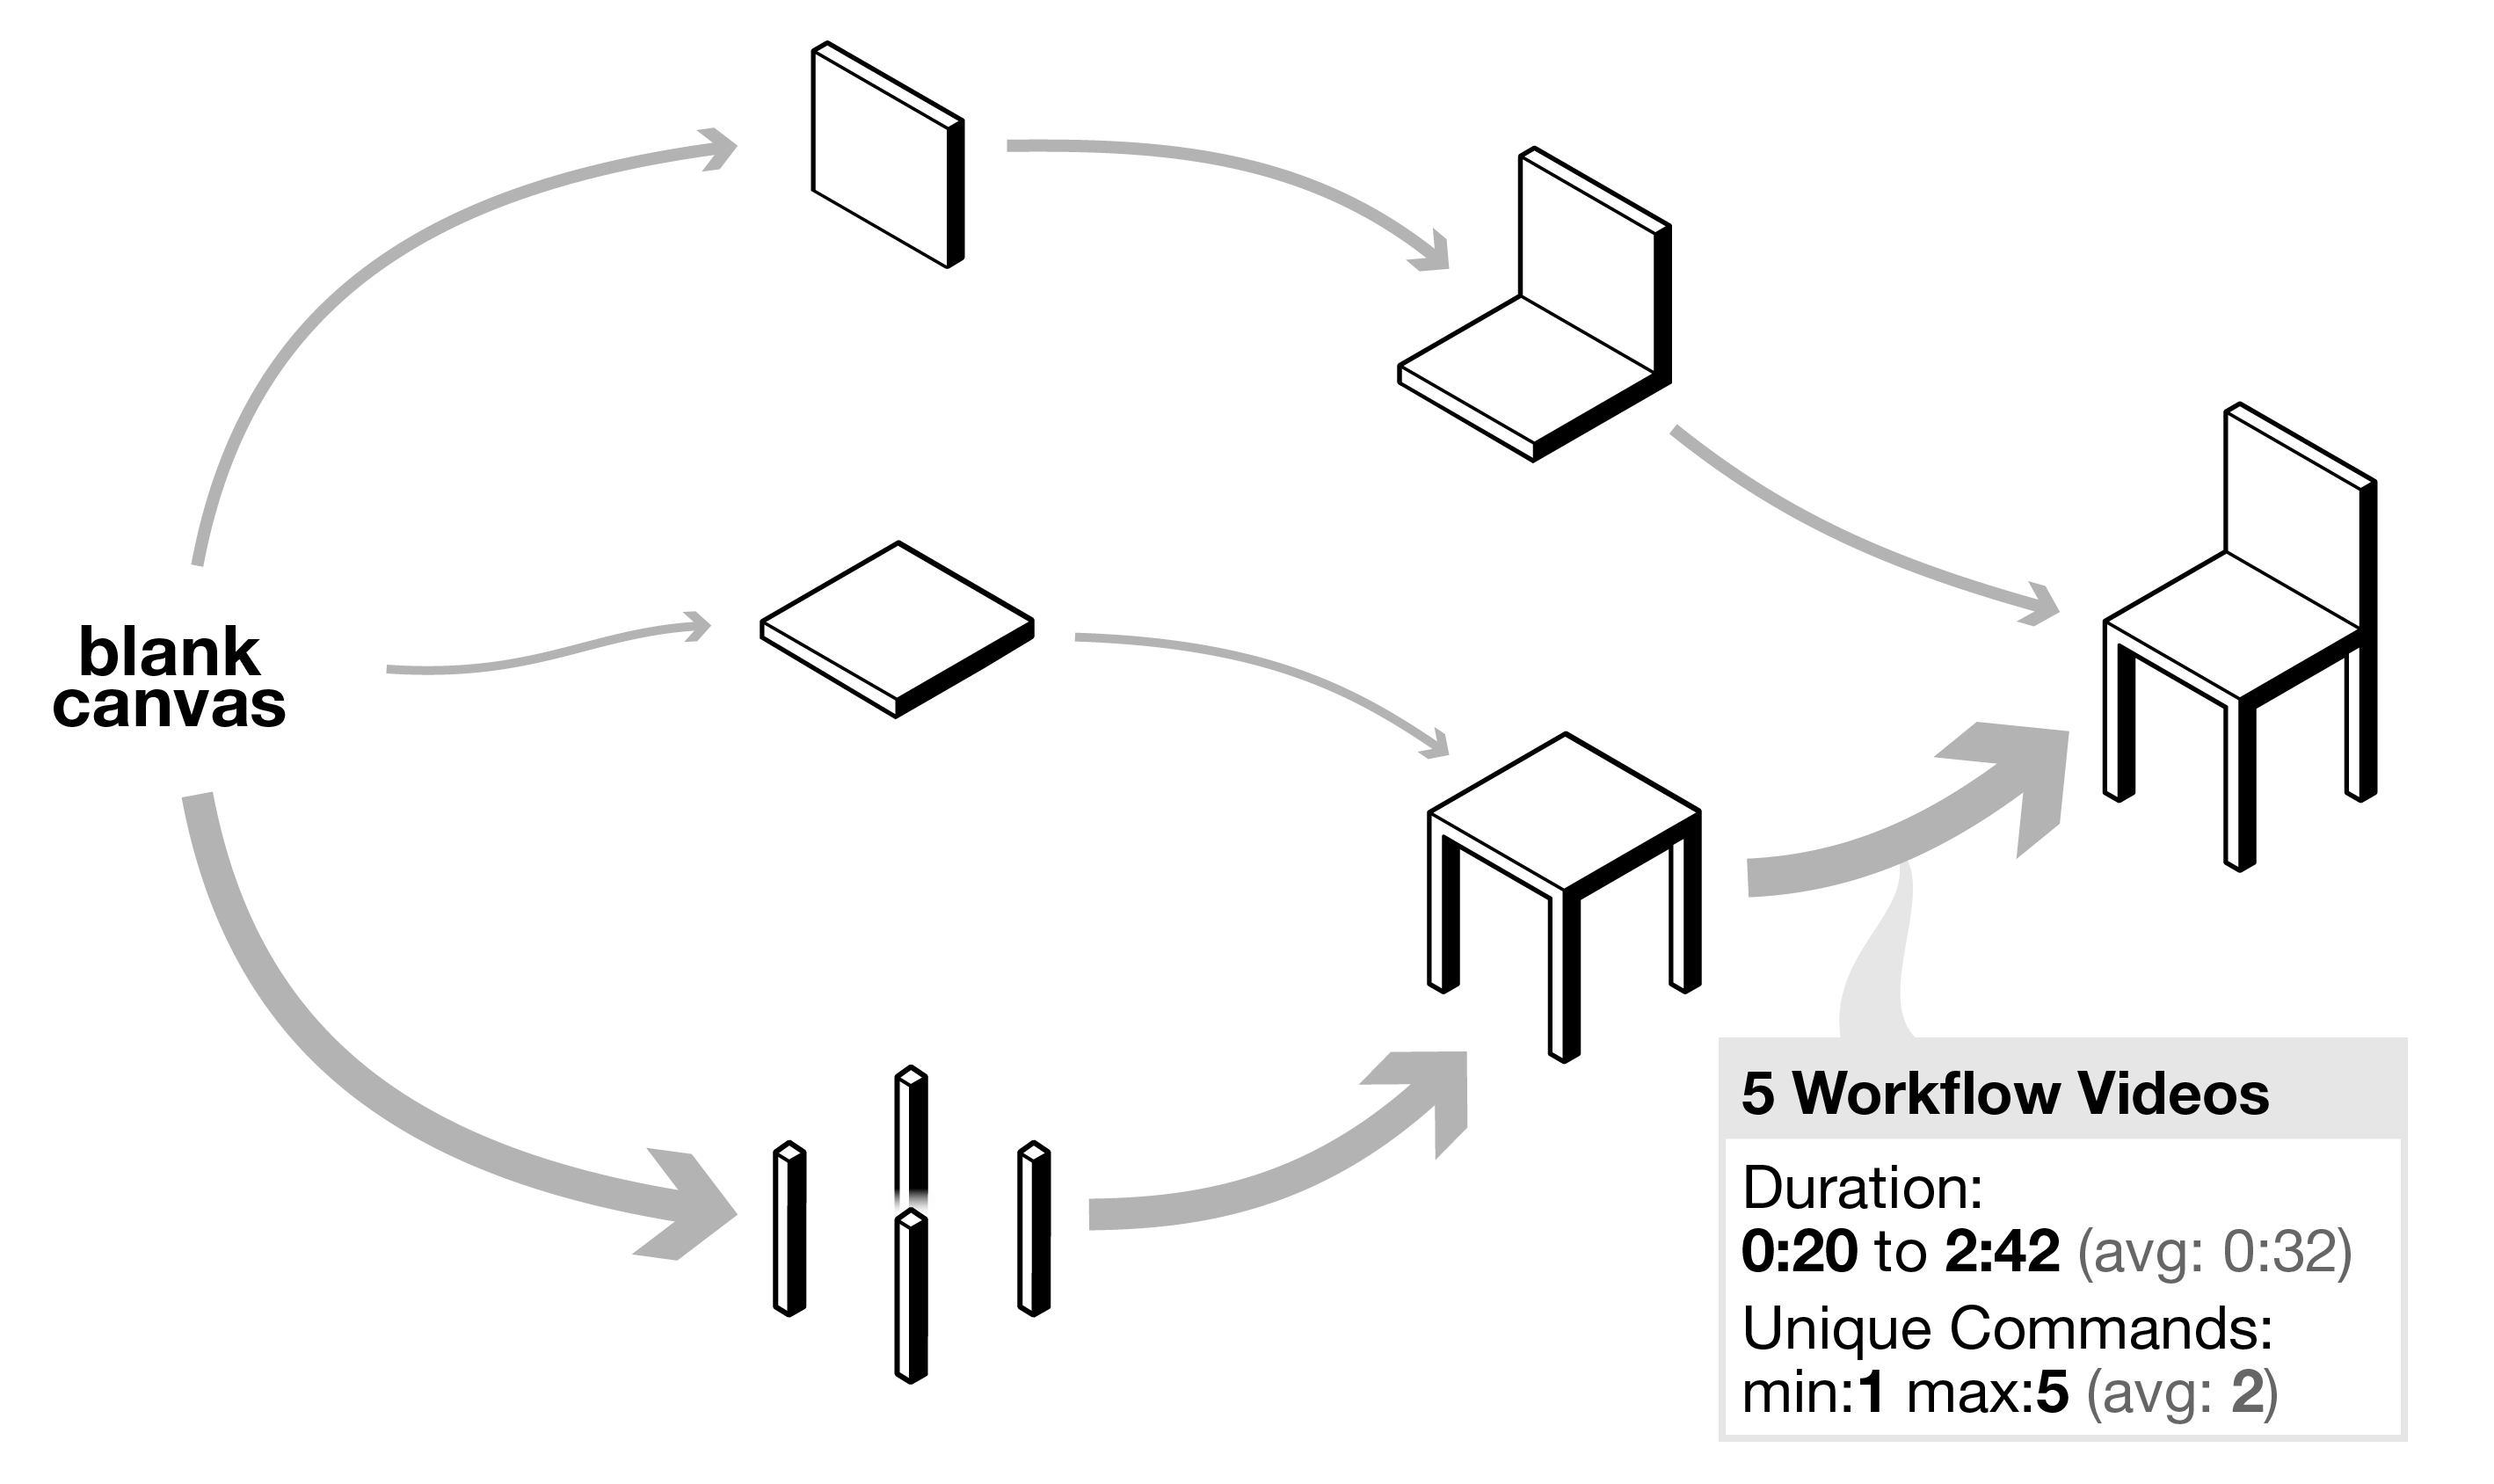
In this research, we investigate how multiple demonstrations of a fixed task can be captured and represented in a workflow graph (W-graph) (Figure 1). The idea is to automatically discover the different means of accomplishing a goal from the interaction traces of multiple users, and to encode these in a graph representation. The graph thus represents diverse understanding of the task, opening up arange of possible applications.
W-graphs encode multiple demonstrations of a fixed task, based on commonalities in the workflows employed by users. Nodes represent semantically similar states across demonstrations. Edges represent alternative workflows for sub-tasks. The width of edges represents the number of distinct workflows between two states.
This work has contributed a conceptual approach for representing the different means by which a fixed goal can be achieved in feature rich software, based on recordings of user demonstrations, and has demonstrated a scalable pipeline for constructing such a representation for 3D modeling software. It has also presented a range of applications that could leverage this representation to support users in improving their skill sets over time. Overall, we see this work as a first step toward enabling a new generation of help and learning systems for feature-rich software, powered by data-driven models of tasks and workflows.
           @inproceedings{Chang:2020:10.20380/GI2020.13,
abbr={GI},
 author = {Chang, Minsuk and Lafreniere, Ben and Kim, Juho and Fitzmaurice, George and Grossman, Tovi},
 title = {Workflow Graphs: A Computational Model of Collective Task Strategies for 3D Design Software},
 booktitle = {Proceedings of Graphics Interface 2020},
 series = {GI 2020},
 year = {2020},
 isbn = {978-0-9947868-5-2},
 location = {University of Toronto},
 pages = {114 -- 124},
 numpages = {11},
 doi = {10.20380/GI2020.13},
 publisher = {Canadian Human-Computer Communications Society / Société canadienne du dialogue humain-machine},
}